CoresightIQ · Inventory intelligence
Inventory control built for how warehouses actually run.
Real time inventory, picking, and operational health metrics for distributors. CoresightIQ shows where capital is tied up, where service is at risk, and where smarter stocking decisions will improve results. Deployed fast, built around your process, and yours when it's done.
Why it exists
Built by someone who's been on the floor
We've watched forklift drivers waste hours looking for pallets the system says are there. We've seen spreadsheets that only one person understands become mission critical.
We built CoresightIQ because most WMS platforms are too complex, too expensive, and built for consultants, not operators.
What you get
The short version
-
Operators learn it in days, not weeks
The screens match how the floor already works. Receiving, putaway, picking, counts. No training binder required.
-
Health metrics you can act on
A live operational pulse of your inventory. Where capital is parked, which SKUs put service at risk, where stocking decisions are costing you.
-
Built around your workflow, not ours
Package size conversions, deposit tracking, lot traceability. If your operation has a quirk the big platforms can't handle, that quirk is exactly what we build for.
The intelligence layer
Coresight IQYour live inventory intelligence layer
Most inventory systems are a really accurate record of the past. IQ reads the same stuff overnight (sales history, what's on hand, what's already on order) and turns it into the calls you'd otherwise be making from memory.
Twelve views, all off the same nightly run, so no two screens ever tell you different numbers.
What's at risk
How long each SKU lasts at the rate it's actually selling, scored against your supplier's lead time and whether demand is picking up.
- Coverage
- Stockout
- Health
- Forecast
What to buy
Order quantities back up to your max, with supplier minimums and case packs already worked in. Every line tells you why it's there.
- Replenish
- Min Max
- Fast Movers
Where the cash is
Every dollar on the floor split into buckets that don't overlap, so excess and dead stock show up as money instead of just units.
- Capital
- Deadstock
- Margins
- Customers
- Ask AI
OvernightRuns nightly, or whenever you ask
Every lineShows you how it got there
Your historyYour numbers, not industry averages
See it
What it actually looks like
A real system with a lubricants distributor's catalogue loaded in. Motor oils, hydraulic fluid, drums, DEF. Not a mockup.
-
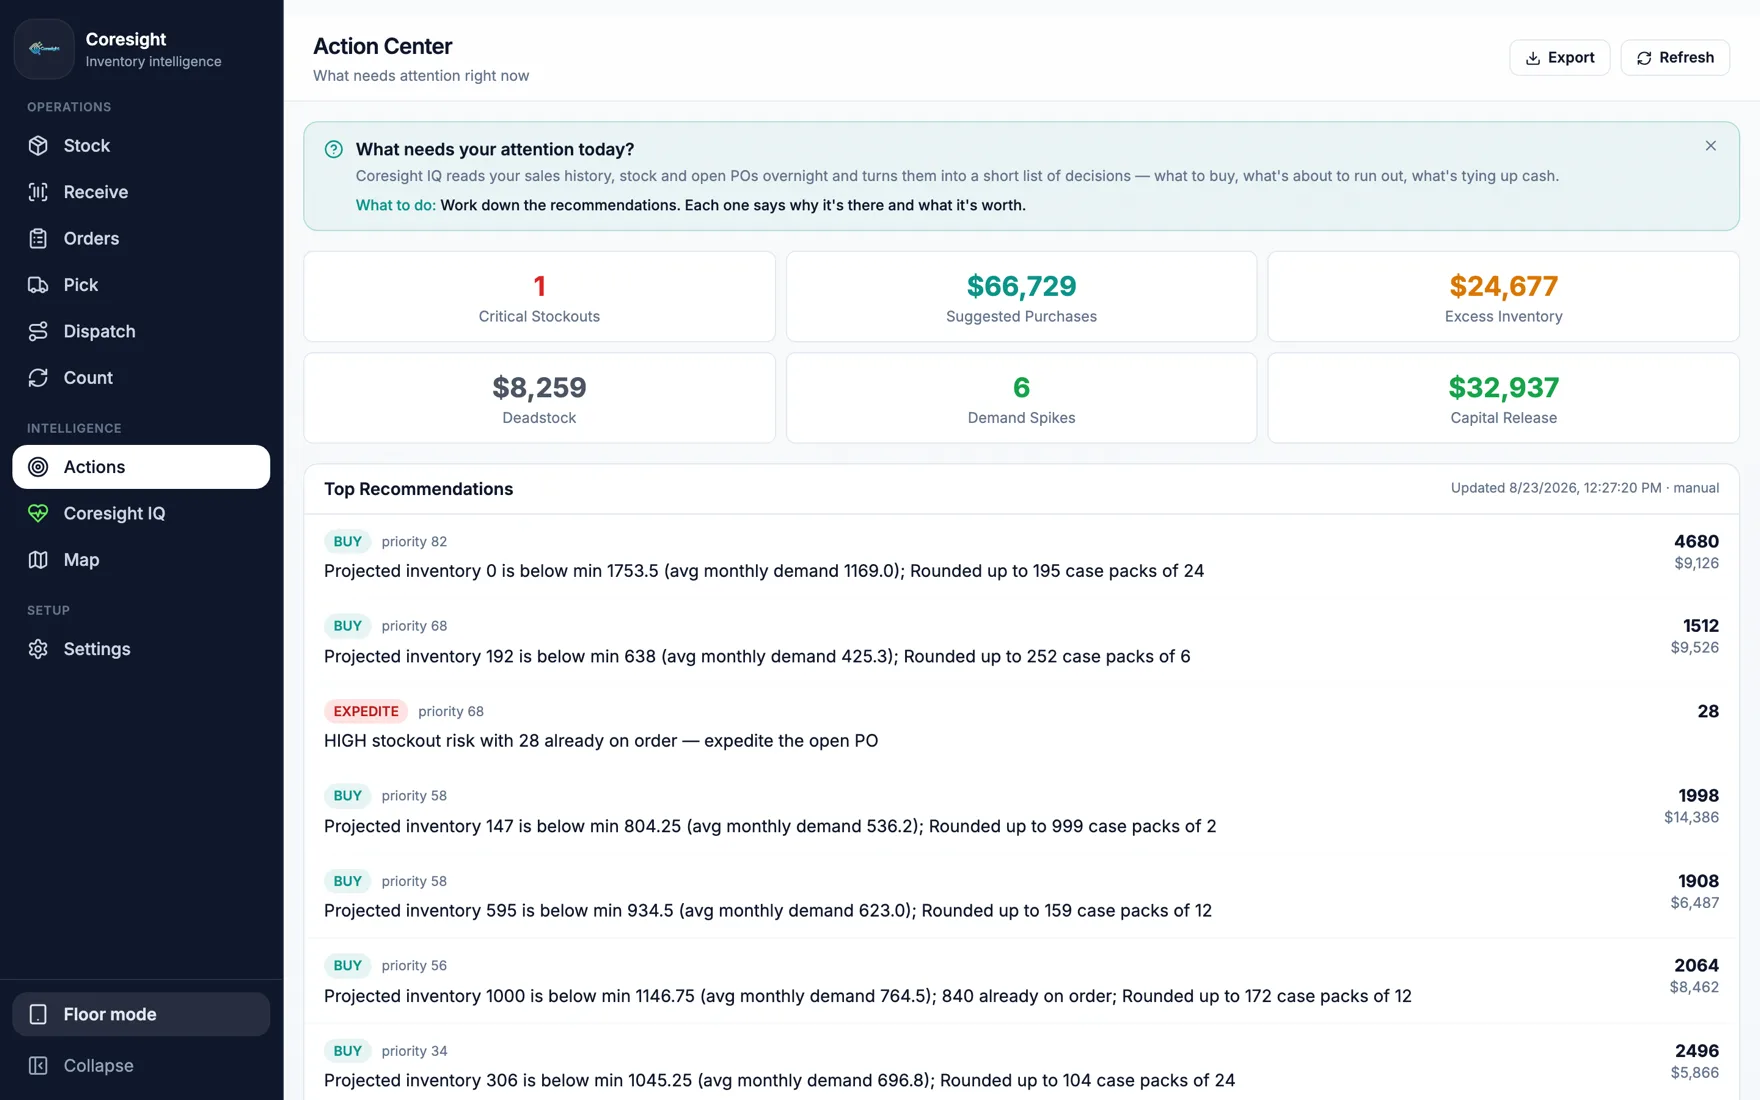
It tells you what to do, not just what you have
Every recommendation shows how it got there: projected inventory 184 is below min 638, rounded up to 253 case packs of 6. You can argue with it, which is why you can trust it.
-
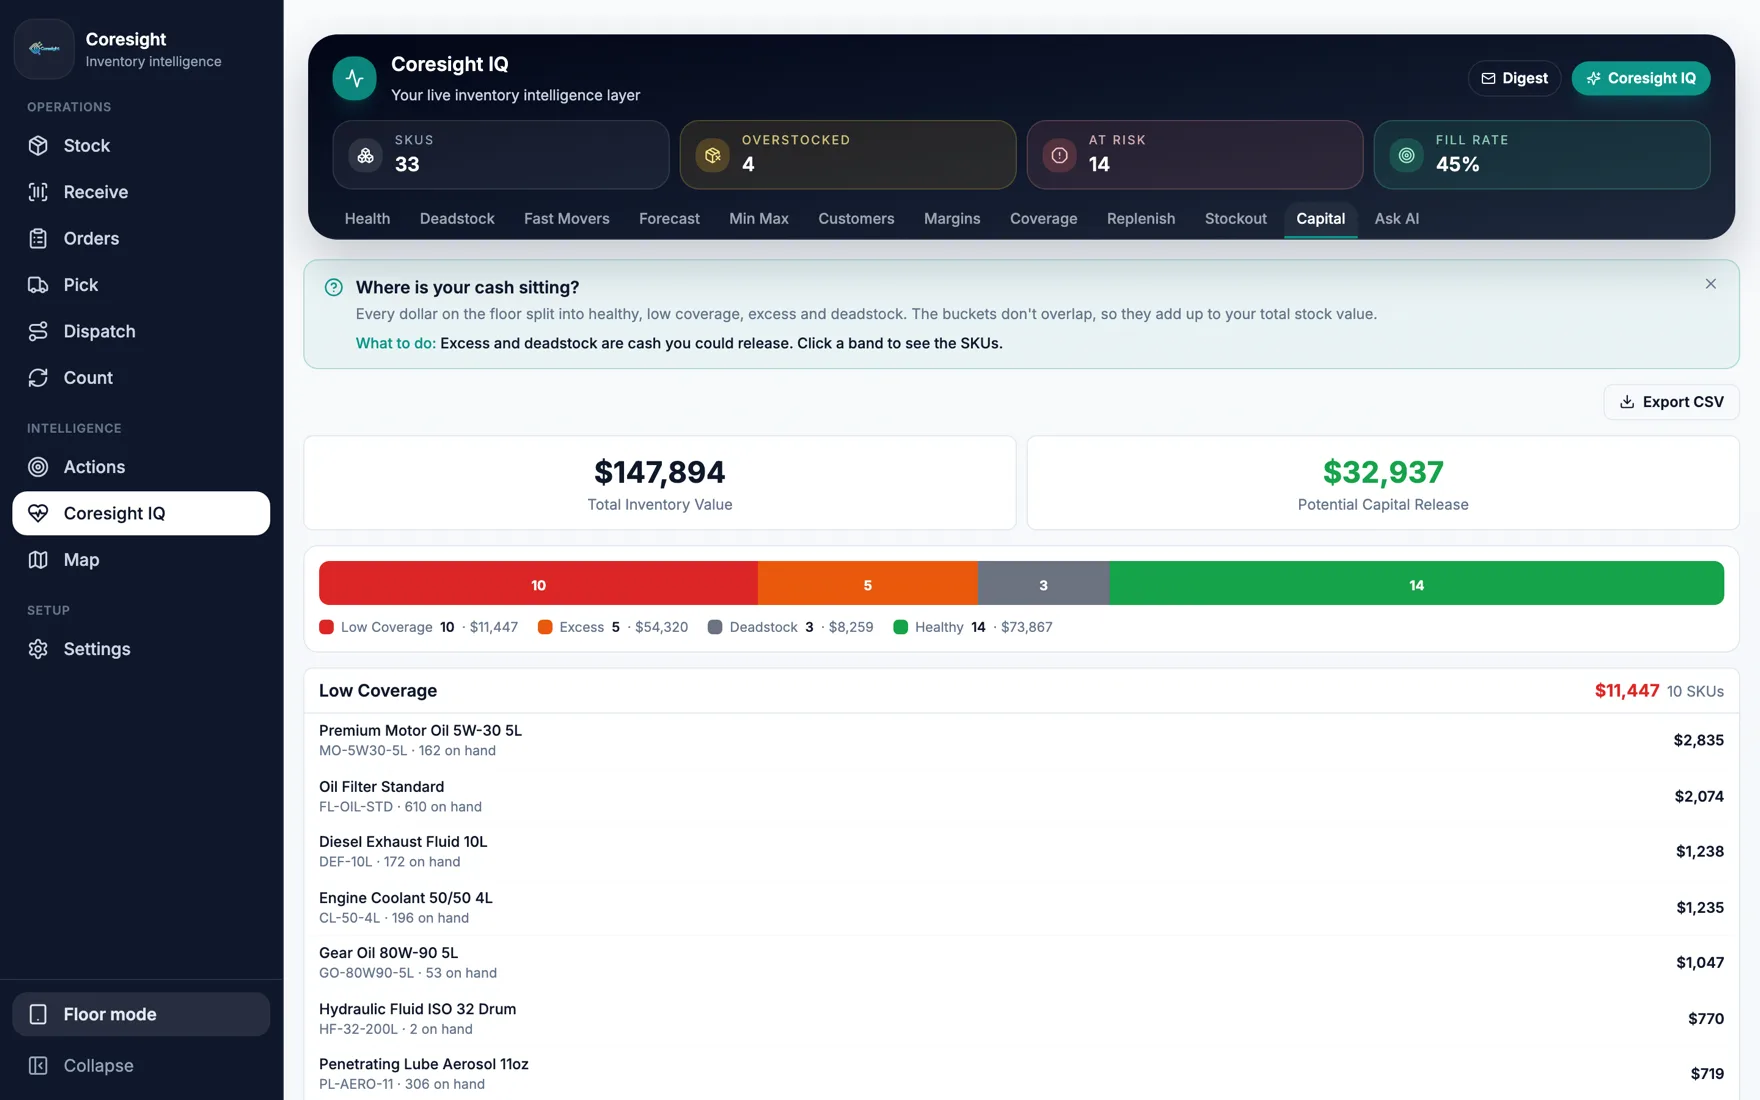
Where your cash is parked
Every dollar on the floor sorted into healthy, low coverage, excess and dead. The buckets don't overlap, so they add up to your stock value. Those last two columns are money you could get back.
-
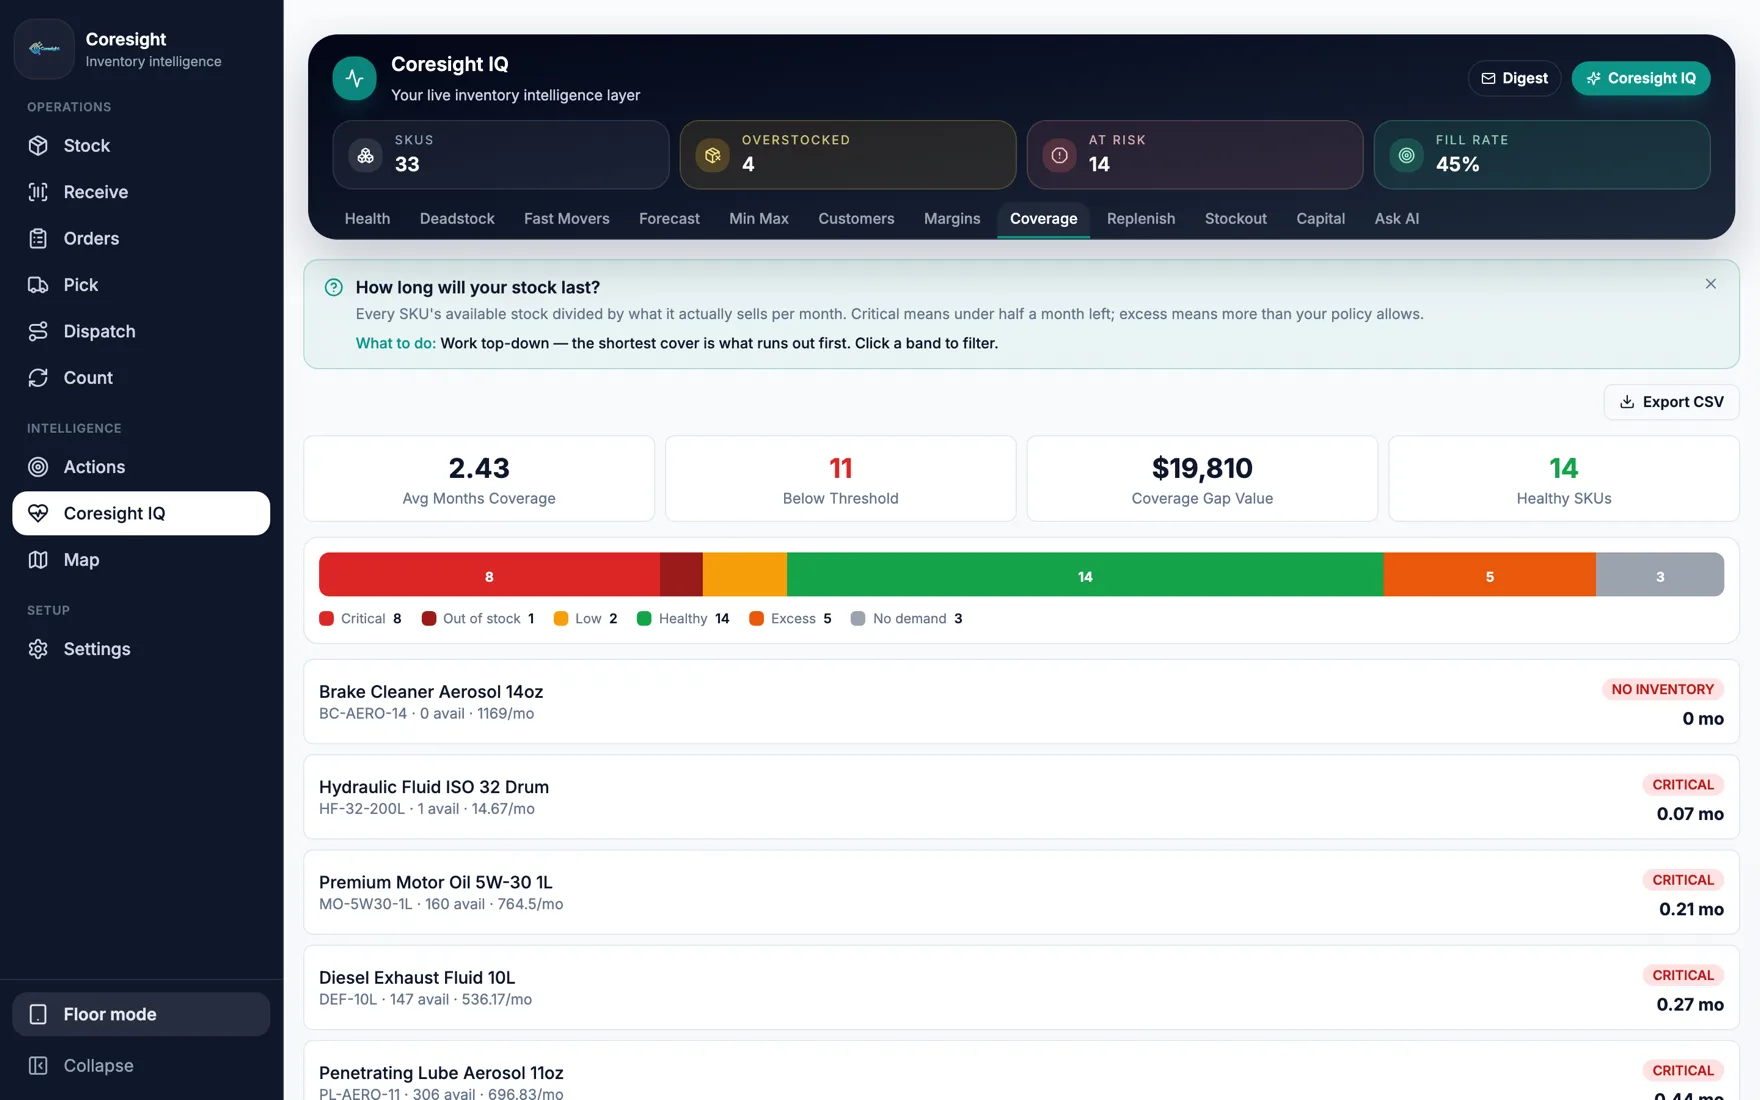
How long everything lasts, at the rate it actually sells
Not units on hand. Months of cover. Click a band and the list filters to the SKUs behind that number, so the count and the reason are never more than a tap apart.
-
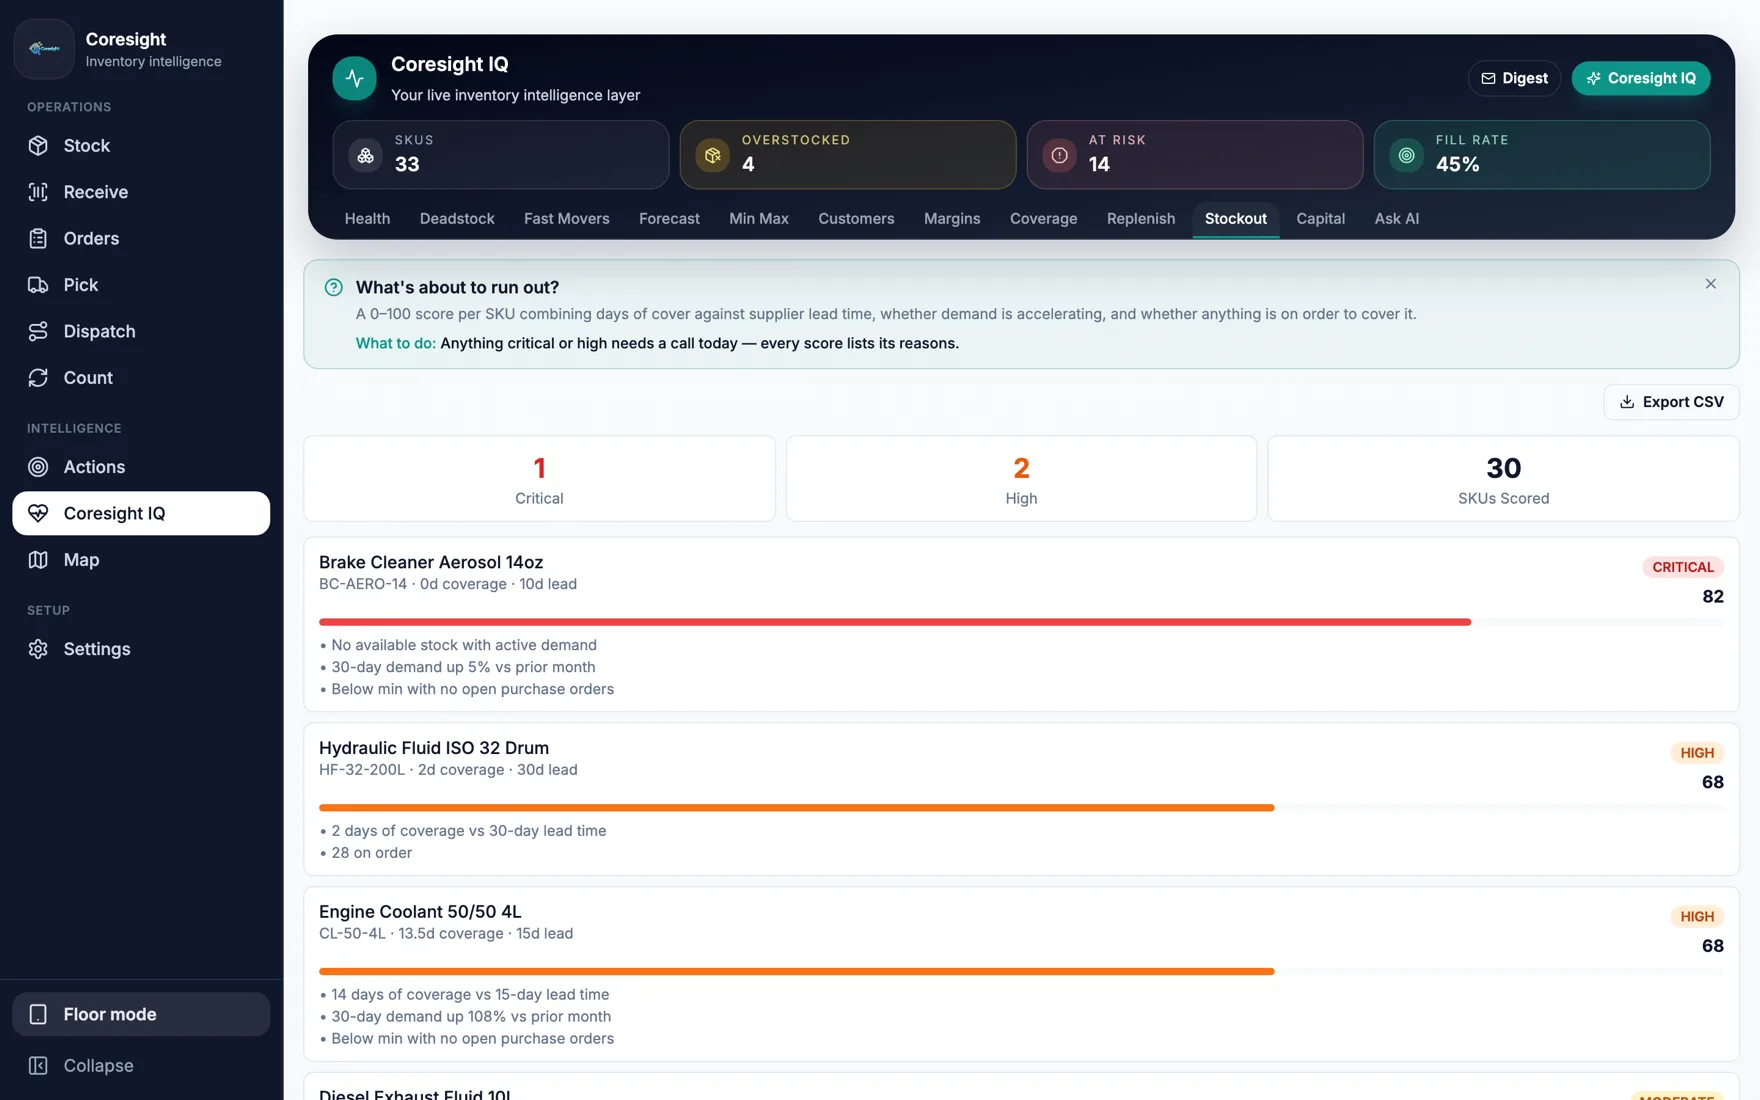
What's about to run out, and why
Days of cover against supplier lead time, whether demand is picking up, and whether anything is already on order to catch it. Every score lists its reasons instead of asking you to just trust it.
-
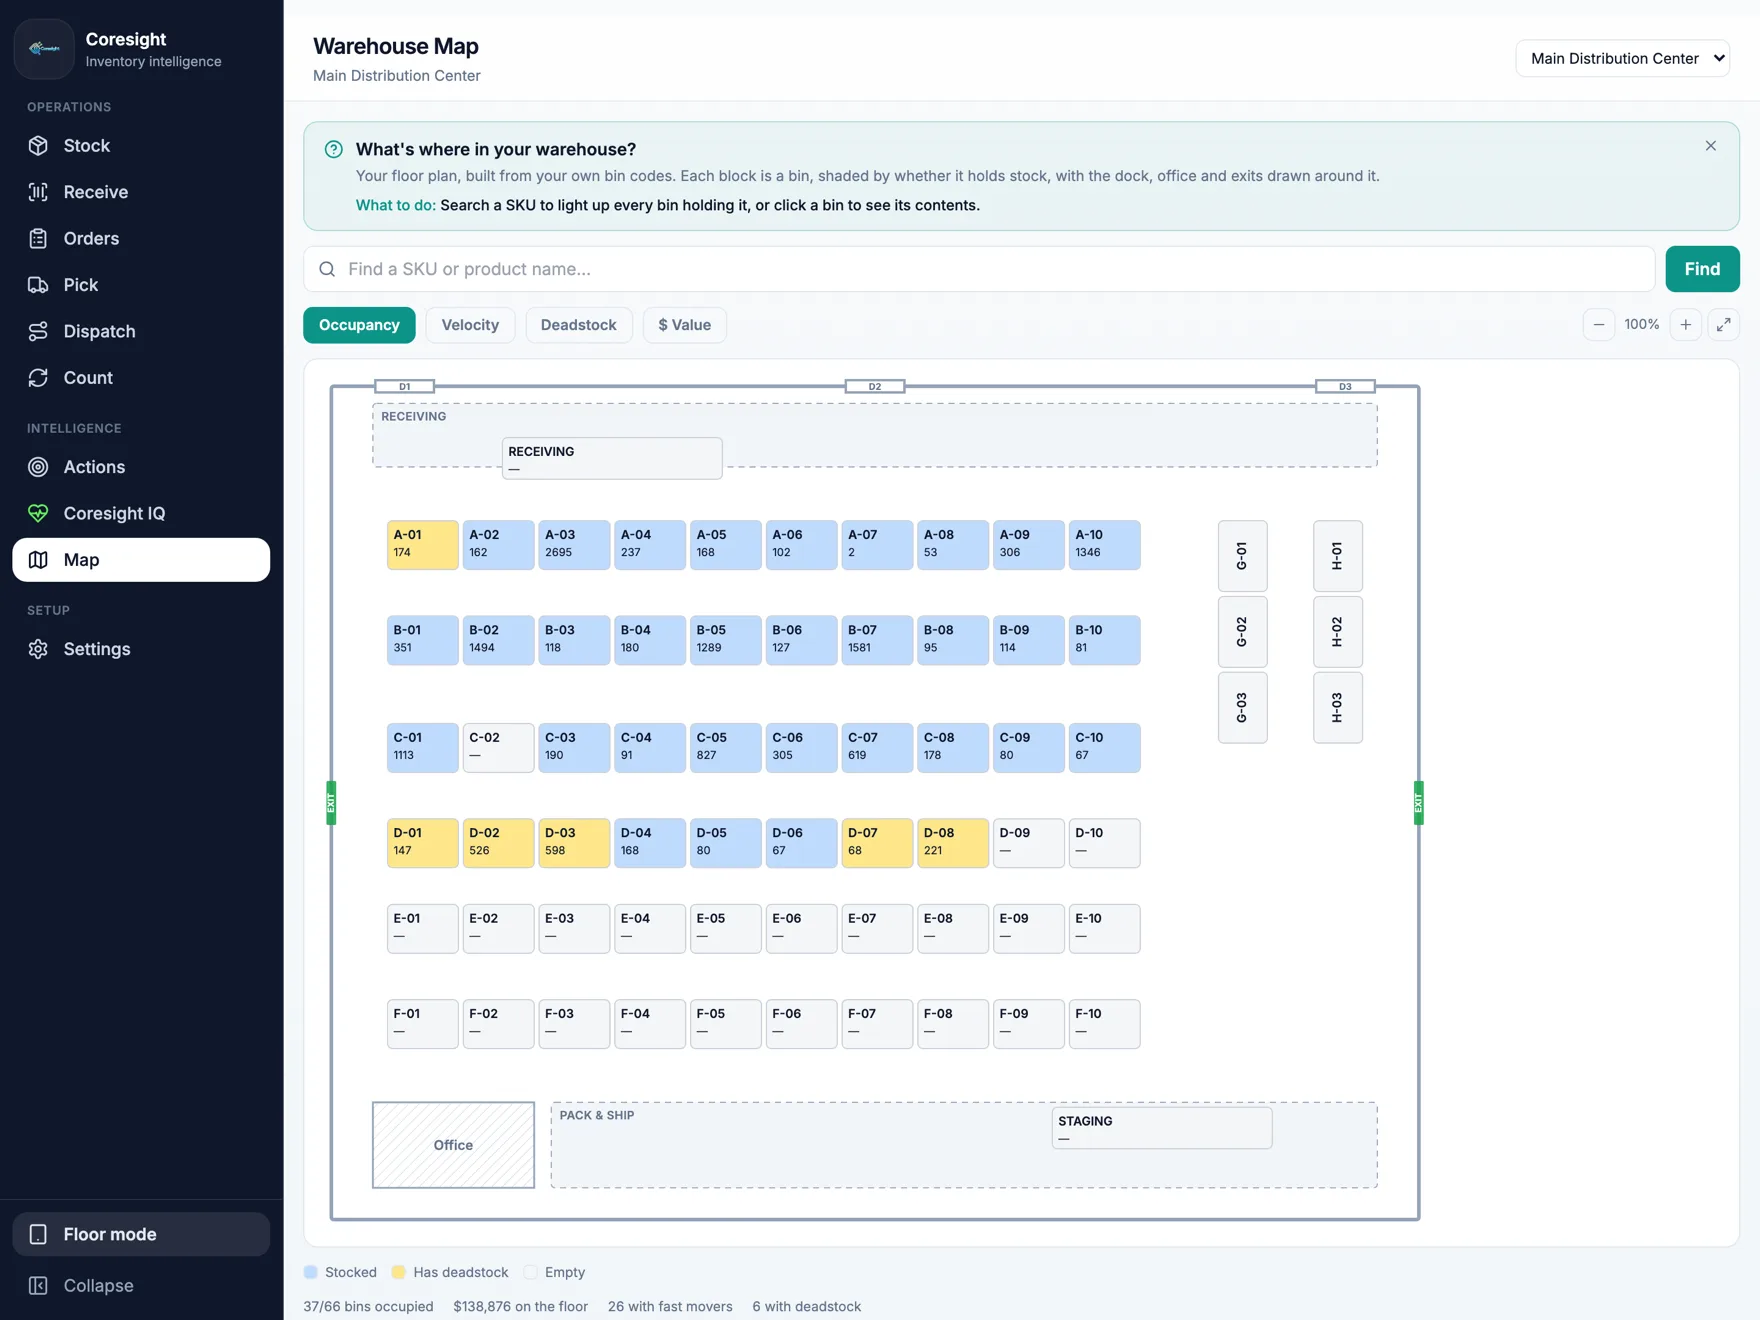
A floor plan that built itself
Drawn from your own bin codes. No CAD file, no setup project. Shade it by occupancy, velocity, deadstock or dollars, or search a SKU and watch its bin light up.
-
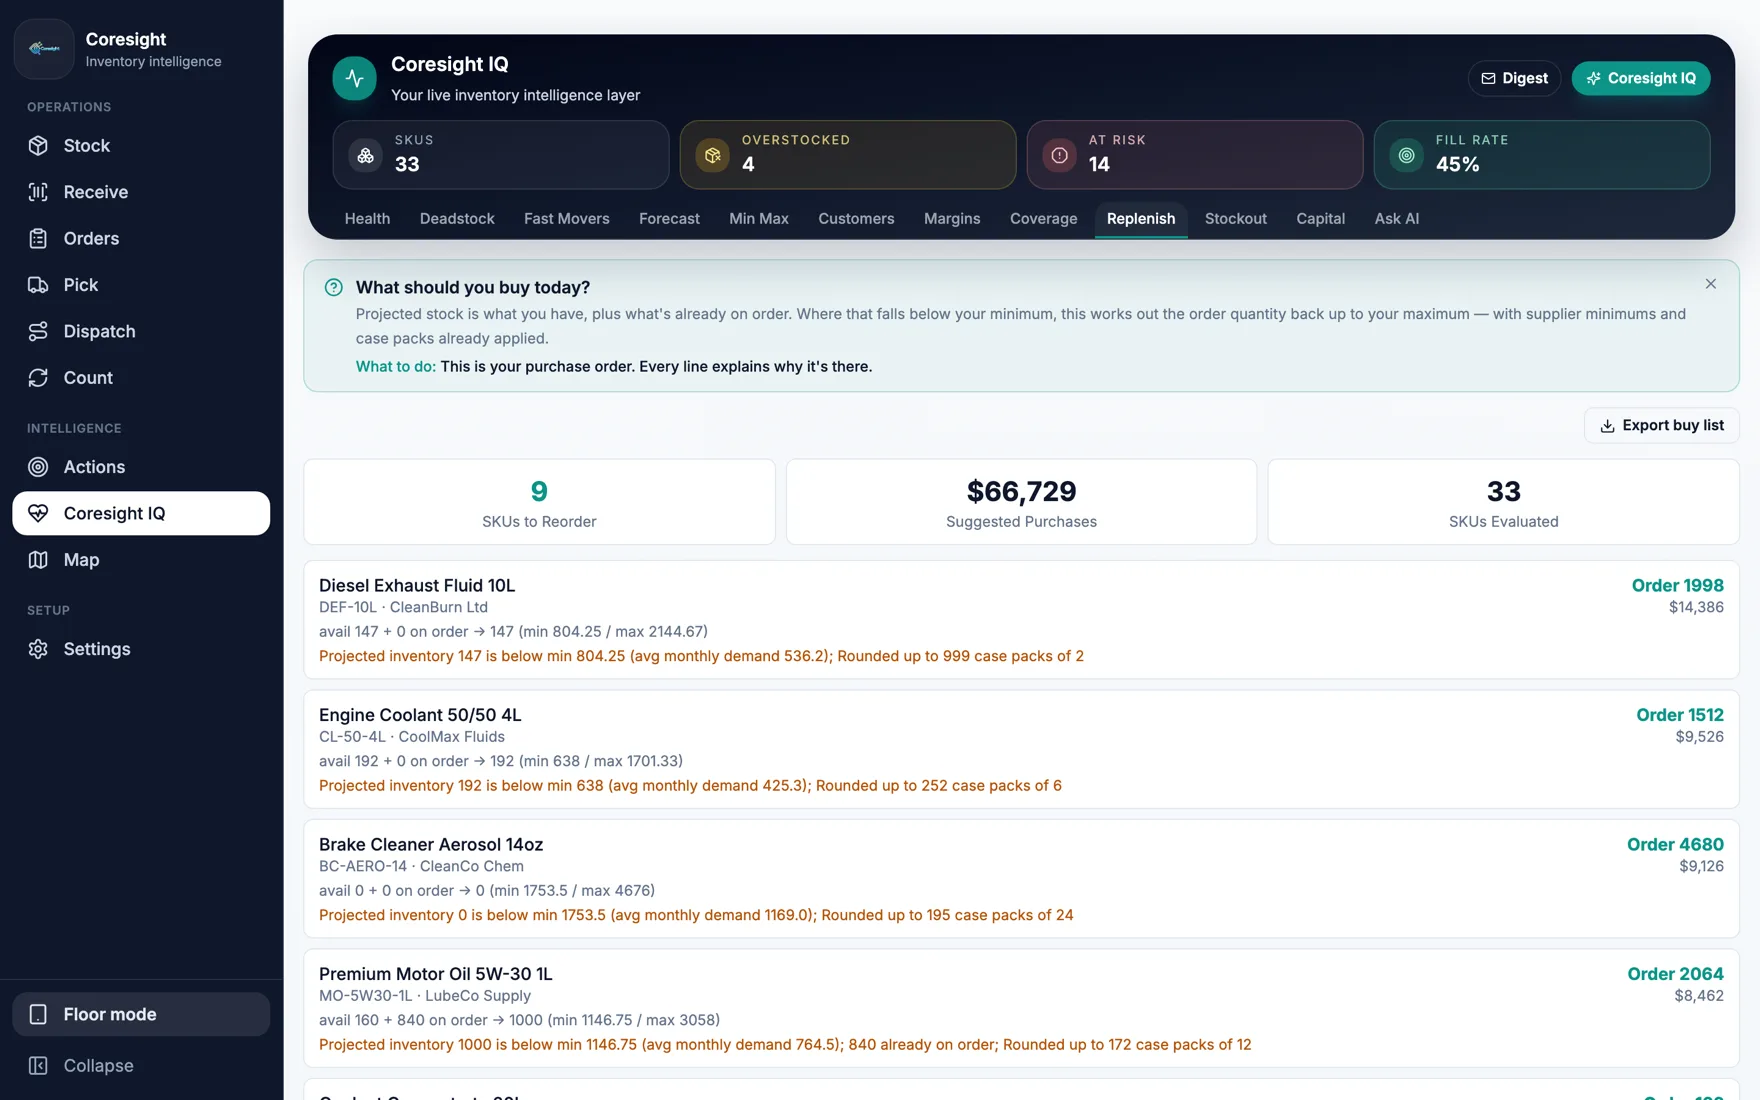
The buy list, not a report about the buy list
Supplier minimums and case packs are already worked in, so you can order the quantities exactly as they sit. Export it and send it.
-
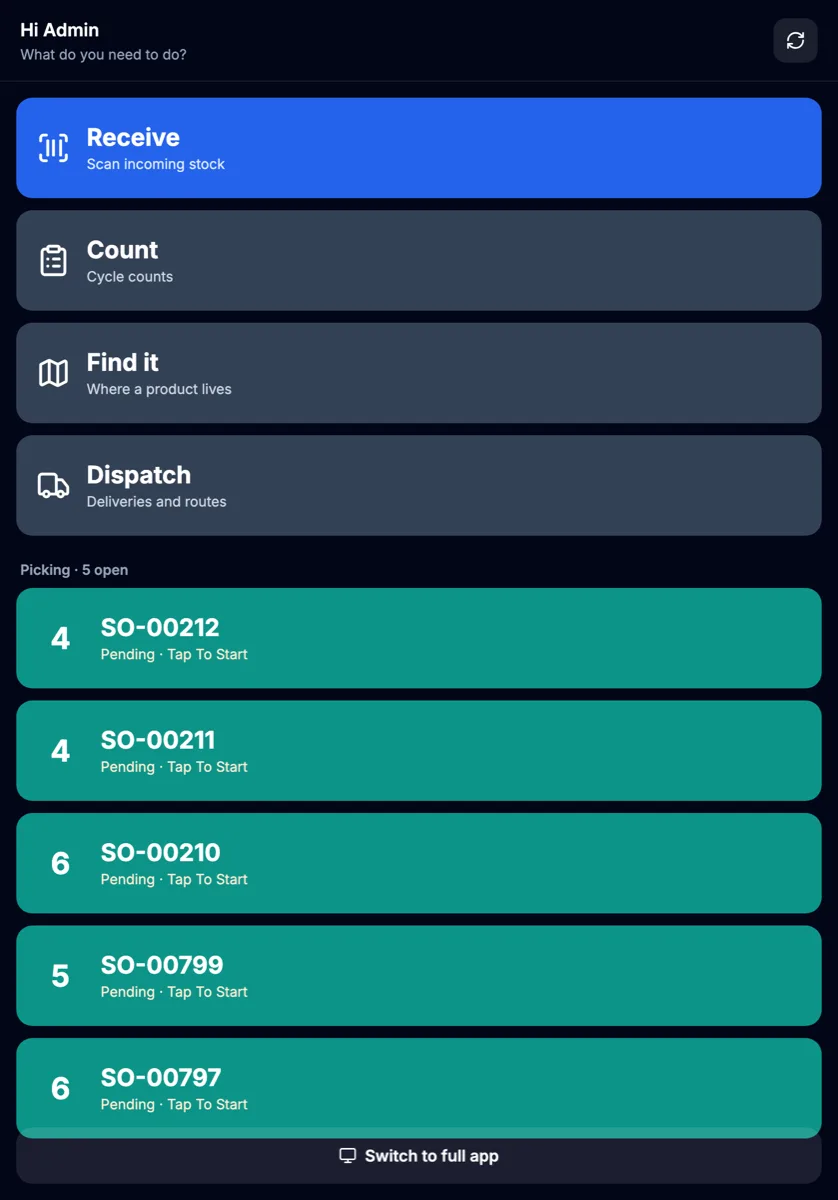
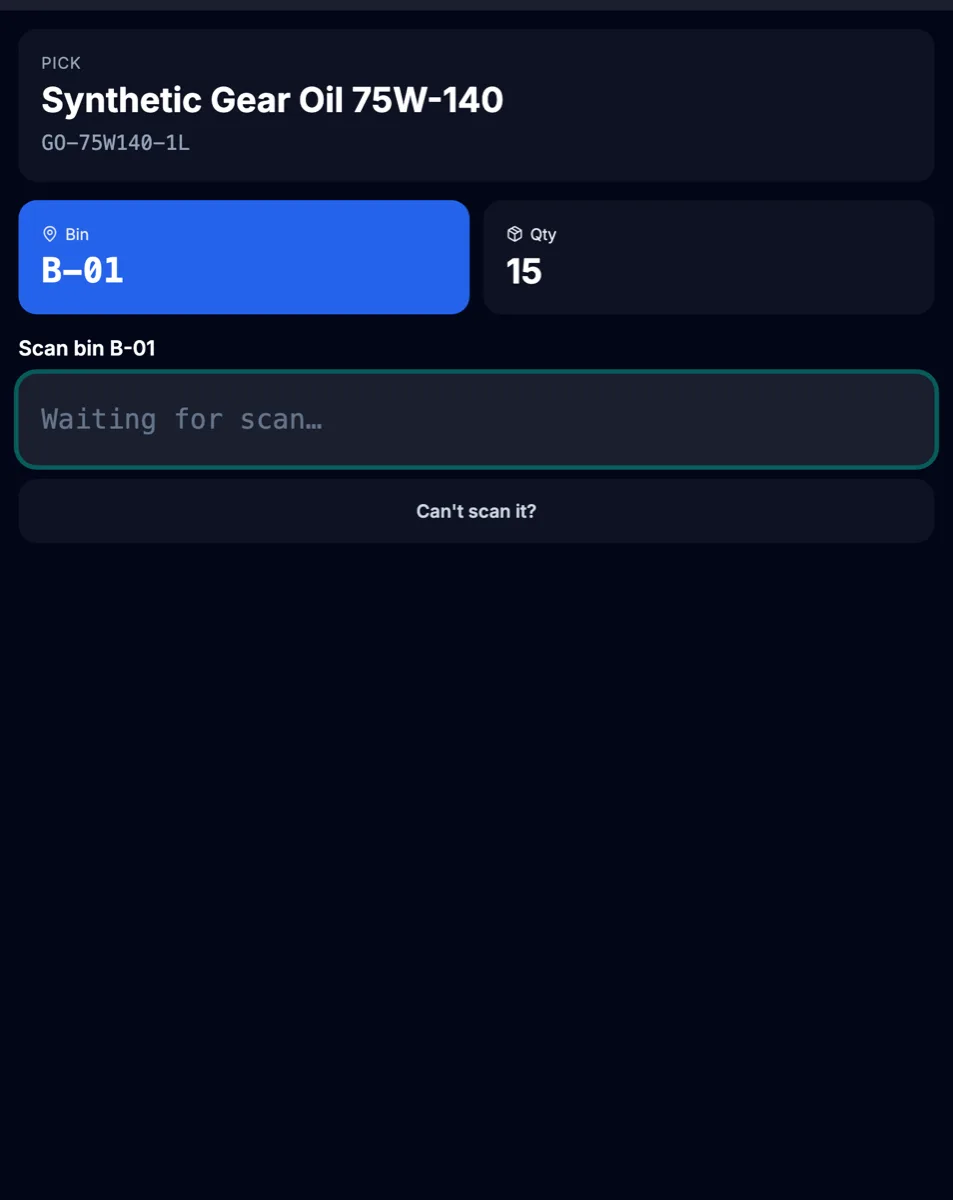
A different interface for the floor
Big targets, dark screen, one job at a time. A Bluetooth scanner pairs like a keyboard and drives the whole thing without a single tap, it beeps so nobody has to look at the tablet, and it keeps working in dead zones then syncs once signal comes back.
Screenshots show sample data
Get in touch
Tell me how your warehouse runs. I'll tell you what I'd build.
Call any time. If I'm heads-down building, leave a message and you'll hear back the same day.